097号 page 102/212

このページは 097号 の電子ブックに掲載されている102ページの概要です。
秒後に電子ブックの対象ページへ移動します。
「電子ブックを開く」をクリックすると今すぐ対象ページへ移動します。
概要:
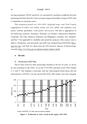
92 高知論叢 第97号moving maximum). ENSO sensitivity was measured by correlation coeffi cient betweenpercentage deviation from the 5-year moving average and monthly average of SOI (Juneto September in....
92 高知論叢 第97号moving maximum). ENSO sensitivity was measured by correlation coeffi cient betweenpercentage deviation from the 5-year moving average and monthly average of SOI (Juneto September in concurrent years).The estimation period was 1961-2000. Analyzed crops were Total Cereals(aggregation of wheat, rice, barley, maize, rye, oats, millet, and sorghum), rice,maize, soybean, groundnut, sweet potato, and cassava. The data is aggregation ofthe following countries: Myanmar, Thailand, Lao People’s Democratic Republic,Cambodia, Viet Nam, Malaysia, Indonesia, the Philippines, Australia, New Zealand*,and Fiji (* Not applicable to variability and sensitivity analyses). Data sources were asfollows. Production, area harvested, and yield were obtained from FAOSTAT (http://apps.fao.org/) and SOI was taken from the SOI Archives, Bureau of Meteorology,Australia (http://www.bom.gov.au/climate/current/soihtm1.shtml).4. Results1) Occurrence of El NinoThe El Nino event has been increasingly frequent in the last 40 years, as shownby one occurrence in the 1960s, two in the 1970-1980s and three in the 1990s (Figure5, 6, and 7). This finding is consistent with the well-accepted observations that thecharacteristics of ENSO, over the second half of the 20th century, may have changed,0501001502001961196519701972197519771980198219851987199019911994199519972000YearMillion tonsFigure 5. Production of total cereals in the region, 1961-2000Source: FAOSTAT. El Nino years are shown in shadow.