097号 page 104/212

このページは 097号 の電子ブックに掲載されている104ページの概要です。
秒後に電子ブックの対象ページへ移動します。
「電子ブックを開く」をクリックすると今すぐ対象ページへ移動します。
概要:
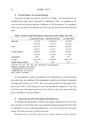
94 高知論叢 第97号2) El Nino impacts on cereal productionThe results of regression analyses are shown in Table 1. All three functions arewell fitted with a high value of adjusted R2. Coefficient of ....
94 高知論叢 第97号2) El Nino impacts on cereal productionThe results of regression analyses are shown in Table 1. All three functions arewell fitted with a high value of adjusted R2. Coefficient of “Year” was significant at the1 per cent level for the three functions. Coefficient of “El Nino dummy” was significantat the 1 per cent level for production and at the 5 per cent level for area harvested andyield.Table 1 Results of regression analyses, total cereals, in the region, 1961-2000Ln production (ton) Area harvested (ha) Ln yield (t/ha)Intercept - 43.12** -1.02E+9** -34.33**(-32.54)b (-16.73) (-30.36)Year 0.0311** 540,911** 0.0212**(46.52) (17.67) (37.10)El Nino dummya -0.0803** -232,155* -0.0401*(-4.156) (-2.624) (-2.434)Adjusted R2 0.98 0.89 0.97F value 1,082.70** 155.892** 689.717**Durbin-Watson statistic 1.36 0.68 1.00a1 for 1965, 1972, 1977, 1982, 1987, 1991, 1994 and 1997, and 0 otherwise.bNumbers in parentheses are t-statistics.** Significant at the 1 per cent level.* Significant at the 5 per cent level.Source: Author’s calculation.As the dependent variable of production and yield functions were transformedinto natural log, the coefficient of the independent variable can be directly interpretedas change ratio (Naylor et al., 1997). Thus, total cereal production of the region in theperiod from 1961 to 2000 had grown 3 per cent annually but dropped by 8 per centin El Nino years. The annual growth rate of its yield was 2 per cent, while in El Ninoyears it declined by 4 per cent (Table 2).3) Characteristics of El Nino-induced production lossTo illustrate the characteristics of the El Nino impact, production loss in El Ninoyears and that in non-El Nino years were compared. During the period of 1961-2000we identified 19 cases of reduced production by 1 per cent or more from the trend,namely, 8 El Nino years and 11 non-El Nino years.Production loss in El Nino years has two distinct features. Firstly, absolute