097号 page 105/212

このページは 097号 の電子ブックに掲載されている105ページの概要です。
秒後に電子ブックの対象ページへ移動します。
「電子ブックを開く」をクリックすると今すぐ対象ページへ移動します。
概要:
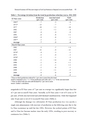
Historical Occurrence of El Nino and its Impact on Food Crop Production at a Regional Level in Asia and the Pacific 95magnitude in El Nino years of 7 per cent on average was significantly larger than ....
Historical Occurrence of El Nino and its Impact on Food Crop Production at a Regional Level in Asia and the Pacific 95magnitude in El Nino years of 7 per cent on average was significantly larger than thatof 3 per cent in non-El Nino years. Secondly, in El Nino years 4 out of 8 cases or 50per cent, of both area harvested and yield declined simultaneously, while that happenedonly 18 per cent (2 out of 11) in non-El Nino years (Table 2).Although the damage was substantial, El Nino production loss was mostly asingle year phenomenon with recovery of production in the following year due to theLa Nina occurrence up until the late 1980s. However, the cyclical pattern of El Ninoand La Nina has become unclear since the early 1990s, resulting in poor recovery orcontinuous loss (Table 3).Table 2. Percentage deviation from the trend in production reduction yearsa, 1961-2000El Nino years Production(per cent)Area harvested(per cent)Yield(per cent)1965* - 7 - 3 - 41972* - 13 - 7 - 71977 - 10 + 3 - 141982 - 2 + 2 - 41987 - 4 - 4 - 01991 - 6 - 8 + 11994* - 9 - 8 - 11997* - 2 - 1 - 2Average - 7 - 3 - 4Non-El Nino years1961 - 3 - 7 + 41967 - 11 - 0 - 121974* - 4 - 3 - 11975 - 3 - 0 - 31976* - 3 - 1 - 31980 - 1 + 6 - 61990 - 1 - 4 + 21993 - 2 - 5 + 31998 - 5 - 0 - 51999 - 1 + 1 - 32000 - 4 - 0 - 4Average - 3 - 1 - 3a Years in which production reduced by 1 per cent or more from the trend.Trend is estimated as ln y = a + bt for production and yield, and: y = a + bt for area harvested.* Years in which both area and yield declined by 1 per cent or more.Source: Author’s calculation.