097号 page 106/212

このページは 097号 の電子ブックに掲載されている106ページの概要です。
秒後に電子ブックの対象ページへ移動します。
「電子ブックを開く」をクリックすると今すぐ対象ページへ移動します。
概要:
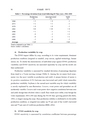
96 高知論叢 第97号Table 3. Percentage deviation from trend following El Nino years, 1961-2000Production(%)Area harvested(%)Yield(%)1966 + 3 + 4 - 11973 + 1 + 2 - 11978 + 4 + 6 - 21983 +14 + 10 + 4198....
96 高知論叢 第97号Table 3. Percentage deviation from trend following El Nino years, 1961-2000Production(%)Area harvested(%)Yield(%)1966 + 3 + 4 - 11973 + 1 + 2 - 11978 + 4 + 6 - 21983 +14 + 10 + 41988 + 1 - 1 + 21992 - 0 - 3 + 31995 - 0 - 1 + 11998 - 5 - 0 - 5Average + 2.3 + 2.0 + 0.3Trend is estimated as per Table 2.2.Source: Author’s calculation.4) Production variability by cropThe ENSO impact differs by crop, according to its water requirement, dominantproduction condition (irrigated or rainfed), crop season, applied technology, farmerchoice, etc. To clarify the characteristics of individual crops against ENSO, productionvariability and ENSO sensitivity are measured separately by crop and the results arethen synthesized.Production variability is measured by standard deviation of percentage departurefrom trend as a 5-year moving average (Table 4). Among the six major food crops,maize was the most variable in production and yield. A unique feature of maize isits positive correlation (0.53) between area harvested and yield which intensifiesproduction variability. Soybean is the second most unstable crop for which variabilityis mostly explained by area fluctuation. Cassava, sweet potato and groundnut are allmoderately variable. Cassava and sweet potato show negative correlation between areaand yield, though their absolute value is small. Rice stands most stable, even though thewater requirement, 600-1,000 mm during the 90-100 days growing period (De Datta,1981), is largest among the crops. Rice production stability is attributed to its favorableproduction condition, as irrigated rice makes up 55 per cent of the world’s harvestedarea and 75 per cent of world rice production (IRRI, 2002).5) ENSO sensitivity by cropENSO sensitivity is measured by correlation coefficient between percentage