097号 page 107/212

このページは 097号 の電子ブックに掲載されている107ページの概要です。
秒後に電子ブックの対象ページへ移動します。
「電子ブックを開く」をクリックすると今すぐ対象ページへ移動します。
概要:
Historical Occurrence of El Nino and its Impact on Food Crop Production at a Regional Level in Asia and the Pacific 97departure from a 5-year moving average and SOI (monthly average of June toSeptembe....
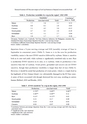
Historical Occurrence of El Nino and its Impact on Food Crop Production at a Regional Level in Asia and the Pacific 97departure from a 5-year moving average and SOI (monthly average of June toSeptember in concurrent years) (Table 5). Same as is in the case for productionvariability, maize is the most ENSO sensitive followed by soybean. Maize is sensitiveboth in its area and yield, while soybean is significantly correlated only in area. Riceis moderately ENSO sensitive in its area, as is soybean, while its production is lesssensitive than that of soybean. Sweet potato, groundnut and cassava are not ENSOsensitive, though their production variability is larger than that of rice (Table 4).However, it should be noted that production of sweet potato, which is a staple food inthe highlands of New Guinea Island, was substantially damaged in the El Nino years.A series of frosts associated with drought destroyed this root crop, resulting in seriousfamine (Ballard, 2000 and Bourke, 2000).Table 4. Production variability by crop in the region1, 1963-1998Variability2 Correlation3Production Area harvested Yield Area vs. YieldMaize 7.7 5.6 3.2 0.53Soybean 6.8 6.2 2.8 0.03Cassava 5.1 4.5 3.0 -0.12Sweet potato 4.7 4.5 2.6 -0.19Groundnut 4.2 3.1 2.7 0.04Rice 2.6 1.7 1.7 0.181Myanmar, Thailand, Laos, Cambodia, Viet Nam, Malaysia, Indonesia, the Philippines, Australia, Fiji.2Standard deviation of percentage departure from the 5-year moving average.3Correlation coefficient of percentage departure from the 5-year moving average.Source: Author’s calculation.Table 5. ENSO sensitivity1 by crop in the region, 1963-1998Production Area harvested YieldMaize 0.78** 0.69** 0.68**Soybean 0.49** 0.49** 0.11Rice 0.35* 0.52** 0.02Sweet potato 0.21 0.17 0.09Groundnut 0.14 0.19 -0.01Cassava -0.01 -0.07 0.091Correlation between percentage departure from the 5-year moving average and SOI (Jun-Sep inconcurrent years).** Significant at the 1 per cent level.* Significant at the 5 per cent level.Source: Author’s calculation.