097号 page 121/212

このページは 097号 の電子ブックに掲載されている121ページの概要です。
秒後に電子ブックの対象ページへ移動します。
「電子ブックを開く」をクリックすると今すぐ対象ページへ移動します。
概要:
Recent Adoption and Spatial Diversity of Modern Rice Varieties in the Philippines 1112001 WS, some farmers reported planting the newest varieties, namely: PSB Rc90,PSB Rc94 and NSIC Rc122 released onl....
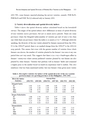
Recent Adoption and Spatial Diversity of Modern Rice Varieties in the Philippines 1112001 WS, some farmers reported planting the newest varieties, namely: PSB Rc90,PSB Rc94 and NSIC Rc122 released only in January 2001.2) Variety diversification and spatial diversity indicesTable 4 shows the spatial diversity indices calculated based on the householdsurveys. The ranges of the spatial indices show differences in terms of spatial diversityof rice varieties across provinces, but not so much across periods. There are someprovinces where the Margalef index-number of varieties per unit of area is less thanone while there are provinces where the index is as much as 6 to 7. Although relativelyspeaking, the diversity of the rice variety planted by farmers increased from the 1992-93 to the 1996-97 period, there is no marked change from the 1996-97 to the 2001-02crop periods. This means that even with the greater number of varieties from whichfarmers can choose, the number of varieties planted in the farmers’ rice area at any oneperiod does not vary much. This suggests that there is in a way a bandwagon effect infarmers’ variety-use where certain preferred varieties planted by one farmer are alsoplanted by other farmers. Varieties that perform well in farmers’ fields and commanda higher price in the market based on hands-on experience tend to endure. This alsoreinforces what has been mentioned earlier; that rice farmers when given more varietyTable 4. Descriptive statistics for indices of the spatial diversity of the rice varietiesgrown in major rice growing provinces of the Philippines, 1992-2002Diversity Index/StatisticsSeason/Year1992 WS 1993 DS 1996 WS 1997 DS 2001 WS 2002 DSMargalef IndexM 3.01 2.21 3.90 3.61 3.58 3.75SD 1.61 1.10 1.16 1.09 1.25 1.30Min 1.48 0.75 1.04 1.44 0.48 0.71Max 7.03 3.82 5.87 5.25 6.01 5.97Berger-ParkerIndexM 2.60 2.74 4.25 4.37 3.52 4.44SD 0.97 0.82 1.95 1.69 1.66 3.45Min 1.15 1.19 1.51 1.88 1.02 1.13Max 4.21 4.33 8.13 8.82 8.50 9.13ShannonIndexM 1.85 1.77 2.19 2.19 2.05 2.13SD 0.53 0.43 0.41 0.39 0.50 0.52Min 0.59 0.56 1.19 1.26 0.13 0.46Max 2.72 2.24 2.85 2.71 2.85 2.93