高知論叢102号 page 5/222

このページは 高知論叢102号 の電子ブックに掲載されている5ページの概要です。
秒後に電子ブックの対象ページへ移動します。
「電子ブックを開く」をクリックすると今すぐ対象ページへ移動します。
概要:
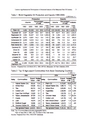
Limits to Agribusiness-led Development: A Structural Analysis of the Malaysian Palm Oil Industry 3Table 1 World Vegetable Oil Production and Exports(1965-2005)(1,000 tons; %)Production ExportsVolu....
Limits to Agribusiness-led Development: A Structural Analysis of the Malaysian Palm Oil Industry 3Table 1 World Vegetable Oil Production and Exports(1965-2005)(1,000 tons; %)Production ExportsVolume Percentagesof total Indexes Volume Percentagesof total Indexes1965 2005 1965 2005(1965= 100) 1965 2005 1965 2005(1965= 100)Palm Oil 1,404 33,326 6.5 28.8 2,373.6 618 26,303 16.4 56.3 4,256.1Soybean Oil 4,037 33,287 18.6 28.7 824.5 727 9,617 19.3 20.6 1,322.8Rapeseed Oil 1,504 16,027 6.9 13.8 1,065.6 94 1,392 2.5 3.0 1,480.9Sunflower Oil 3,072 9,681 14.2 8.4 315.1 326 3,054 8.6 6.5 936.8Cottonseed Oil 2,699 5,033 12.4 4.3 186.5 349 174 9.3 0.4 49.9Groundnut Oil 3,111 4,509 14.3 3.9 144.9 435 186 11.5 0.4 42.8Palm Kernel Oil 397 3,906 1.8 3.4 983.9 96 2,027 2.5 4.3 2,111.5Coconut Oil 2,032 3,143 9.4 2.7 154.7 462 2,090 12.3 4.5 452.4Olive Oil 1,098 2,903 5.1 2.5 264.4 142 681 3.8 1.5 479.6Corn Oil 458 2,099 2.1 1.8 458.3 41 741 1.1 1.6 1,807.3Sesame Oil 506 823 2.3 0.7 162.6 1 34 0.0 0.1 3,400.0Linseed Oil 1,042 607 4.8 0.5 58.3 311 111 8.2 0.2 35.7Castor Oil 330 539 1.5 0.5 163.3 169 304 4.5 0.7 179.9TotalVegetable Oils 21,690 115,883 100.0 100.0 534.3 3,771 46,714 100.0 100.0 1,238.8Source:Prepared from Oil World 2012, 1994, MPOB, Malaysian Oil Palm Statistics 2005.Table 2 Top 10 Agro-export Commodities from Asian Developing Countries($1,000; %)1964 2004 Rate ofchange(1964 ~2004)Ranking Commodities ExportValuePercentagesof Total Ranking Commodities ExportValuePercentagesof Total1 Natural Rubber (Dry) 850,424 13.6 1 Palm Oil 9,172,657 10.0 14,7572 Milled Rice 639,380 10.2 2 Natural Rubber (Dry) 6,908,110 7.5 7123 Tea 602,723 9.6 3 Milled Rice 5,693,003 6.2 7904 Cotton Lint 358,547 5.7 4 Cigarettes 2,520,894 2.8 6,8965 Sugar Raw Centrifugal 318,029 5.1 5 Tea 1,933,730 2.1 2216 Tobacco, Unmanufactured 207,559 3.3 6 Chicken Meat 1,555,223 1.7 59,0347 Copra 190,997 3.1 7 Cotton Lint 1,451,792 1.6 3058 Jute 165,570 2.6 8 Milk Whole Dried 1,224,927 1.3 6,2249 Refined Sugar 160,906 2.6 9 Tobacco, Unmanufactured 1,223,018 1.3 48910 Coconut (Copra) Oil 109,260 1.7 10 Meat of Chicken Canned 1,161,472 1.3 -Total Agricultural Products 6,248,933 100.0 Total Agricultural Products 91,663,432 100.0 1,367Note: Top 10 commodities excluding aggregated items.Palm oil was 20th in 1964, only 1% share of the total value.Source: Prepared from FAO, FAOSTAT Database.